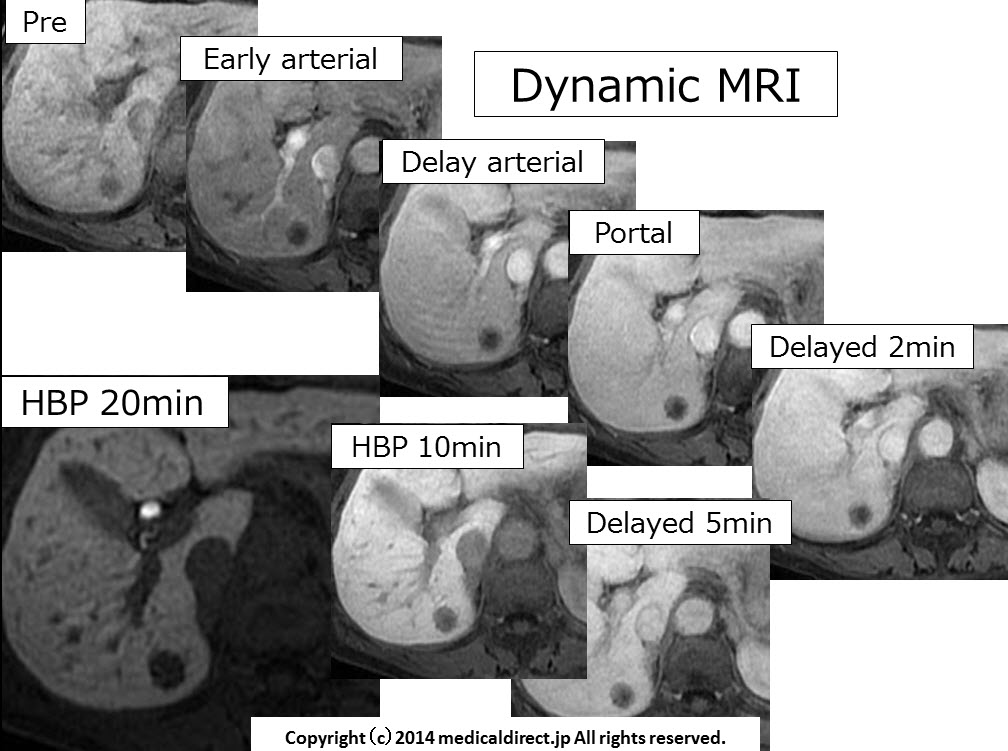
74-year-old man with SOL in the liver.
Key words: Early HCC, nodule in nodule, EOB, EOB-MRI, DN, dysplastic nodule
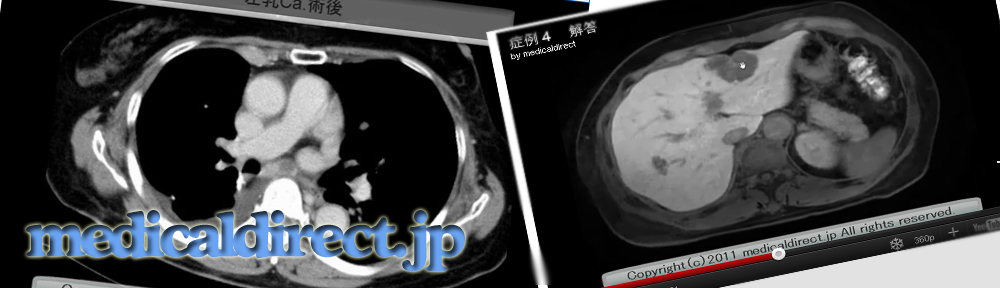
74-year-old man with SOL in the liver.
Key words: Early HCC, nodule in nodule, EOB, EOB-MRI, DN, dysplastic nodule
76-year-old woman with SOL in the liver.
50-something woman with cystic lesion in the liver, answer
Answer: Complicated cyst
DDx: bile duct cystadenocarcinoma, or cystadenomaiPad version
WMV
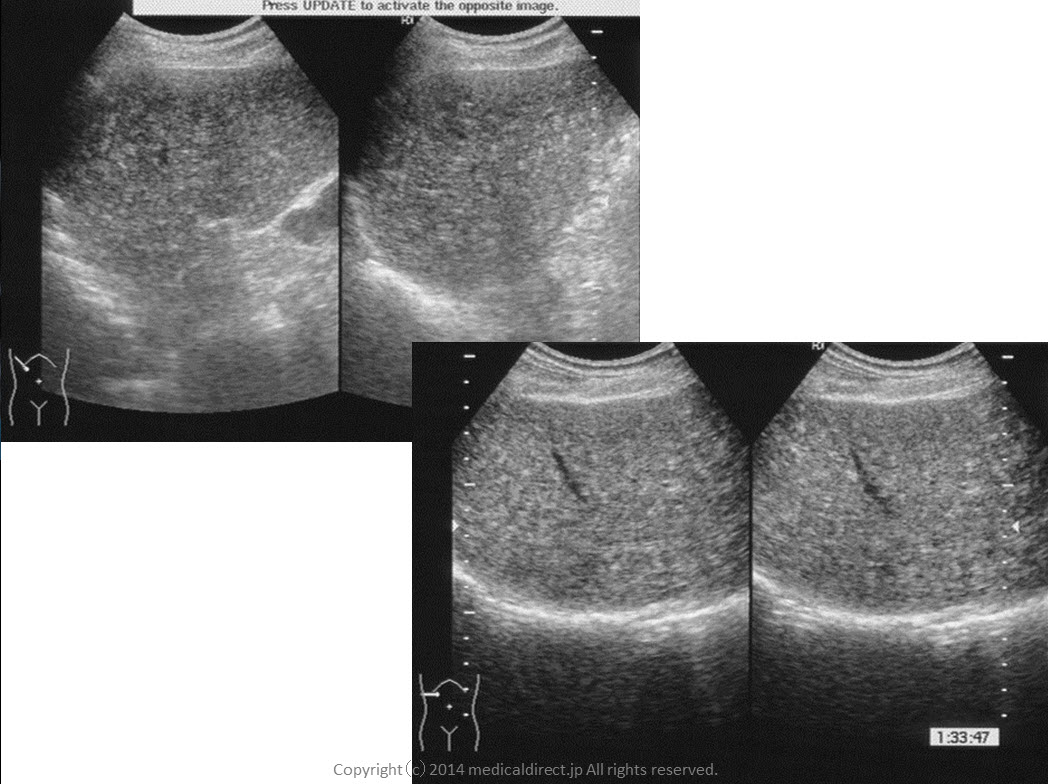
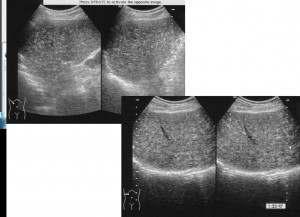
70才台女性、便秘症、肝内SOL指摘
この症例を10分間聞くことで先生が得られる結果
①いつも苦労していた血管腫との鑑別がある方法によって簡単になります。
実はこの方法は昔から使われていましたが、最近のある論文で再び見直されました。
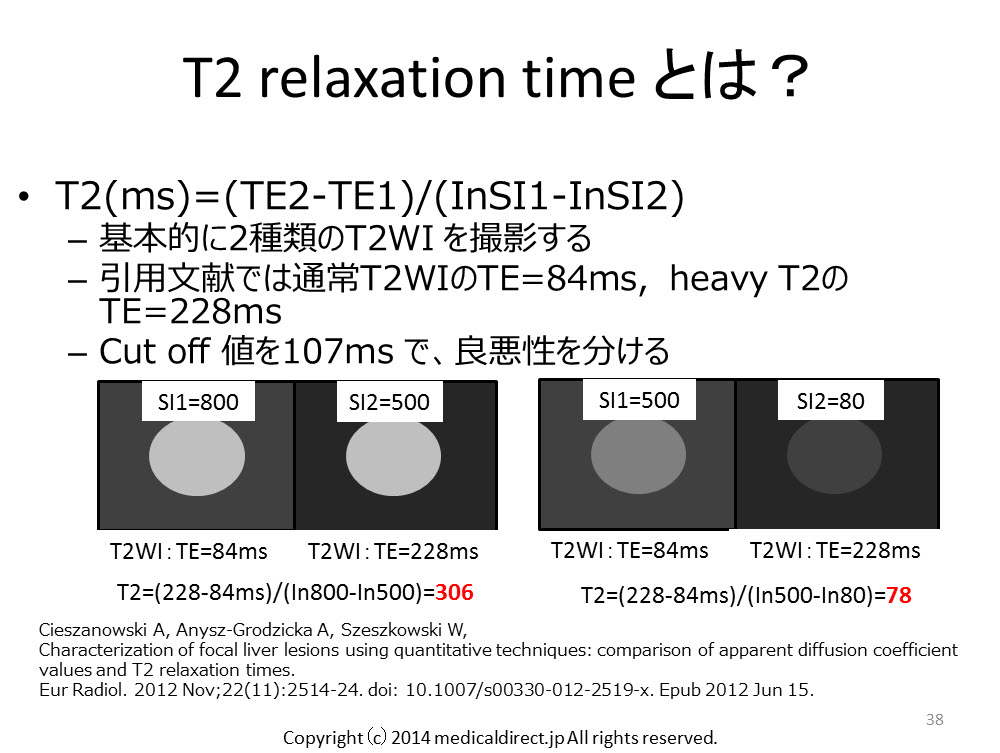
CieszanowskiA, Anysz-Grodzicka A, Szeszkowski W,
Characterization of focal liver lesions using quantitative techniques: comparison of apparent diffusion coefficient values and T2 relaxation times.
EurRadiol. 2012 Nov;22(11):2514-24. doi: 10.1007/s00330-012-2519-x. Epub 2012 Jun 15.
この論文では ADC map(accuracy 81%) より T2 relaxation time (同 89%)の方が使えると言っています。
論文は2012年とこのVideo をアップしたときには非常に新しいものです。
②上記を知ったうえで、今回の症例のように注意が非常に必要な症例 つまり例外を知ることも重要です。日常診療で輝きを増すには例外を明確に知っているかで決まります。T2 relaxation time を使いこなし、例外も知ることでEOB-MRIでの血管腫との鑑別が容易になります。
③粘液癌、粘液産生性腺癌 vs. 血管腫は 永遠のテーマであるが、実は症例をじっくり眺めているとヒントが得られる可能性もあります。粘液癌、粘液産生性腺癌はT2 relaxation time を使わなくても形態的にも違いが分かります(文献はまだありませんが)
さあ、たった10分です。余った時間で聞いてみてください。
ちなみにこの問題は、ある放射線医学教室の後期研修医に
問題としてだして いくつかある問題のうち9%しか正解の得られなかった難問です。
iPhone, iPad の先生はこちら
You tube version はこちら
Key words: 粘液産生性腺癌、Mucinous adenocarcinoma, mucinous cyst adenocarcinoma, 肝転移、liver metastases, 血管腫、hemangioma, T2 relaxation time, ADC map
Key images.

 Similar cases 類似症例: 1週間以内にスライドアップする予定です。
2014/6/16 Adrenal gland adenoma, differentiation, lipid rich adenoma
iphone, iPad の先生は以下
Point words: 0HU, 10HU, 造影前、35秒、5分、15分, Washout, Wash in, 45%, 60% より大, Signal intensity index, 16.5 より大, 10-20HUは MRI, 20HU超えればWashout CT
Key words: adrenal gland tumor, adrenal gland adenoma, lipid rich adenoma, lipid poor adenoma, non adenoma, Washout CT, inphase, opposed phase
Reference:
腺腫 鑑別診断 主要文献
1) Korobkin M, Brodeur FJ, Yutzy GG, ,et al.
AJR Am J Roentgenol. 1996 Mar;166(3):531-6.
http://www.ncbi.nlm.nih.gov/pubmed/8623622
単純CT上のCT値が10HU以下が腺腫の診断の指標と言った古き良き論文
2) Szolar DH, Korobkin M, Reittner P, et al.
Adrenocortical carcinomas and adrenal pheochromocytomas: mass and enhancement loss evaluation at delayed contrast-enhanced CT.
Radiology. 2005 Feb;234(2):479-85.
http://www.ncbi.nlm.nih.gov/pubmed/15671003
3) Singer AA, Obuchowski NA, Einstein DM, et al.
Metastasis or adenoma? Computed tomographic evaluation of the adrenal mass.
Cleve Clin J Med. 1994 May-Jun;61(3):200-5.
http://www.ncbi.nlm.nih.gov/pubmed/?term=Singer%2C+Cleve+Clin+J+Med+1994
Korobkin の前に10HU, 0HUのカットオフ値で検討した論文
4) van Erkel AR, van Gils AP, Lequin M, et al.
CT and MR distinction of adenomas and nonadenomas of the adrenal gland.
J Comput Assist Tomogr.1994 May-Jun;18(3):432-8. http://www.ncbi.nlm.nih.gov/pubmed/8188912
Korobkin の前に10HU, 0HUのカットオフ値で検討した論文
5) Lee MJ, Hahn PF, Papanicolau N, et al.
Benign and malignant adrenal masses: CT distinction with attenuation coefficients, size, and observer analysis.
Radiology. 1991 May;179(2):415-8.
http://www.ncbi.nlm.nih.gov/pubmed/2014283
Korobkin の前に10HU, 0HUのカットオフ値で検討した論文
6) Kamiyama T, Fukukura Y, Yoneyama T, et al.
Distinguishing adrenal adenomas from nonadenomas: combined use of diagnostic parameters of unenhanced and short 5-minute dynamic enhanced CT protocol.
Radiology. 2009 Feb;250(2):474-81. doi: 10.1148/radiol.2502080302. Epub 2008 Nov 26.
http://www.ncbi.nlm.nih.gov/pubmed/19037020
造影前、35秒、5分を用いたWashout CT で診断できるという画期的な論文である。 それまでは15分待つのが常識で、とてもCT室に何もしないで10分以上患者様にいてもらう事はできない。そのためあきらめざるを得なかったWashout CTを現実に運用可能なものとしてくれた。必ずこの論文は取り寄せるべきでしょう。(WO/WI) x100という計算式は同じで、カットオフ値が45%となっている。
7) Park SW, Kim TN, Yoon JH, et al.
The washout rate on the delayed CT image as a diagnostic tool for adrenal adenoma verified by pathology: a multicenter study.
Int Urol Nephrol. 2012 Oct;44(5):1397-402. doi: 10.1007/s11255-012-0202-4. Epub 2012 Jul 14.
http://www.ncbi.nlm.nih.gov/pubmed/22798018
腺腫と非腺腫鑑別のためのWashout CT の “多施設共同研究”
なので、244人の患者と研究の中で抜きんでている患者数
10HUをカットオフ値にすると感度は45%, 特異度は97%
Washout rate を55% で15分の遅延相だと感度94%, 特異度96%
Washout rate を用いる診断法が単純CTでの診断法より優れる
8) Kumagae Y, Fukukura Y Takumi K, et al.
Distinguishing adrenal adenomas from non-adenomas on dynamic enhanced CT: a comparison of 5 and 10 min delays after intravenous contrast medium injection.
Clin Radiol. 2013 Jul;68(7):696-703. doi: 10.1016/j.crad.2013.01.016. Epub 2013 Mar 5.
9) Sangwaiya MJ, Boland GW, Cronin CG, et al.
Incidental adrenal lesions: accuracy of characterization with contrast-enhanced washoutmultidetector CT–10-minute delayed imaging protocol revisited in a large patient cohort.
Radiology. 2010 Aug;256(2):504-10. doi: 10.1148/radiol.10091386.
http://www.ncbi.nlm.nih.gov/pubmed/20656838
323個の副腎腫瘍 をレトロスペクティブに検討だが、単施設ではもっとも検討個数が多い。10分の遅延相はどうなのか? を15分比較して検討したもの。造影前、75秒, 10分 (3ml/s) を使った検討 造影剤は370mgI/ml
10分 でAPWが55% のカットオフ値だと感度62.5%, 特異度93.3%、正診率 64.0% ととにかく15分の時と比較して感度が低くなる カットオフ値60%とするとさらに感度は52%まで低下してしまう。
10) Caoili EM, Korobkin M, Francis IR, et al.
Adrenal masses: characterization with combined unenhanced and delayed enhanced CT.
Radiology. 2002 Mar;222(3):629-33.
http://www.ncbi.nlm.nih.gov/pubmed/11867777
造影前、60秒、15分(2~3ml/s)を使ったデータ APWのカットオフ値は60%としたところ166個の副腎腫瘍 感度98%, 特異度92%, 166この腫瘍中160個(96%)を正しく診断できたという。Korobkin らの教室。
11) Seo JM, Park BK, Park SY, et al.
Characterization of lipid-poor adrenal adenoma: chemical-shift MRI and washout CT.
AJR Am J Roentgenol. 2014 May;202(5):1043-50. doi: 10.2214/AJR.13.11389.
http://www.ncbi.nlm.nih.gov/pubmed/?term=Jung+Min+Seo+Characterization
2014年6月現在の最新の副腎腺腫鑑別についての論文である 必見
Lipid poor adenoma だけを集めたもの Lipid poor adenoma とは単純CTでの腫瘍のCT値が10HUを超えているもの。つまり単純CT上10HUを超えた副腎腫瘍にフォーカスしている点が画期的。そのため、見当数は52個と少ない。その場合にWashout CT と MRIがどちらが信頼できるか? というもので、もちろんCTの方が信頼出来て、腺腫診断の感度はCT が100%、MRIは76%と劣る。特異度もCTは80%あるが、MRIは60%と有意差をもって劣る。しかし、ここからが重要で、実は単純でのCT値が10~20HUの間のLipid poor adenoma 診断についてはCTもMRIも感度は100%と同等。なので、この間の値を単純CT上示した場合は、被爆や造影剤のリスクを考慮すると、第一選択はMRIとなる。ただし、20HUを超える場合は、Washout CTの方がいい。
12) Park BK, Kim CK, Kim B, et al .
Comparison of delayed enhanced CT and chemical shift MR for evaluating hyperattenuating incidental adrenal masses.
Radiology. 2007 Jun;243(3):760-5.
http://www.ncbi.nlm.nih.gov/pubmed/17517932
11) のSeo らと共同演者であるPark BK の同じような単純CTでのCT値が高い腫瘍を集めてMRIの診断能を検討した論文。Washout CTはMRIで診断できない腫瘍の診断が可能であったと言うもの。MRIでの客観指標としてASR と SIIを使用。ASRとはadrenal-to-spleen ratio で SIIはsignal intensity index である。それぞれの計算式は以下
ASR (SIAO/SISO)/(SIAI/SISI) <0.71
SII (SIAI - SIAO) x 100/SIAI > 16.5
13) Outwater EK, Siegelman ES, Huang AB, Birnbaum BA.
Adrenal masses: correlation between CT attenuation value and chemical shift ratio at MR imaging with in-phase and opposed-phase sequences.
Radiology. 1996 Sep;200(3):749-52. Erratum in: Radiology 1996 Dec;201(3):880.
http://www.ncbi.nlm.nih.gov/pubmed/8756926
上記 Signal intensity index の元となっている論文
14) Fujiyoshi F, Nakajo M, Fukukura Y, et al.
Characterization of adrenal tumors by chemical shift fast low-angle shot MR imaging: comparison of four methods of quantitative evaluation.
AJR Am J Roentgenol. 2003 Jun;180(6):1649-57.
http://www.ncbi.nlm.nih.gov/pubmed/12760936
88人102個の副腎腫瘍についての検討なので信頼度は高め
Signal intensity index が最も信頼できる指標であると結論
adrenal-to-spleen ratio, adrenal-to-muscle ratio, adrenal-to-liver ratio と比較
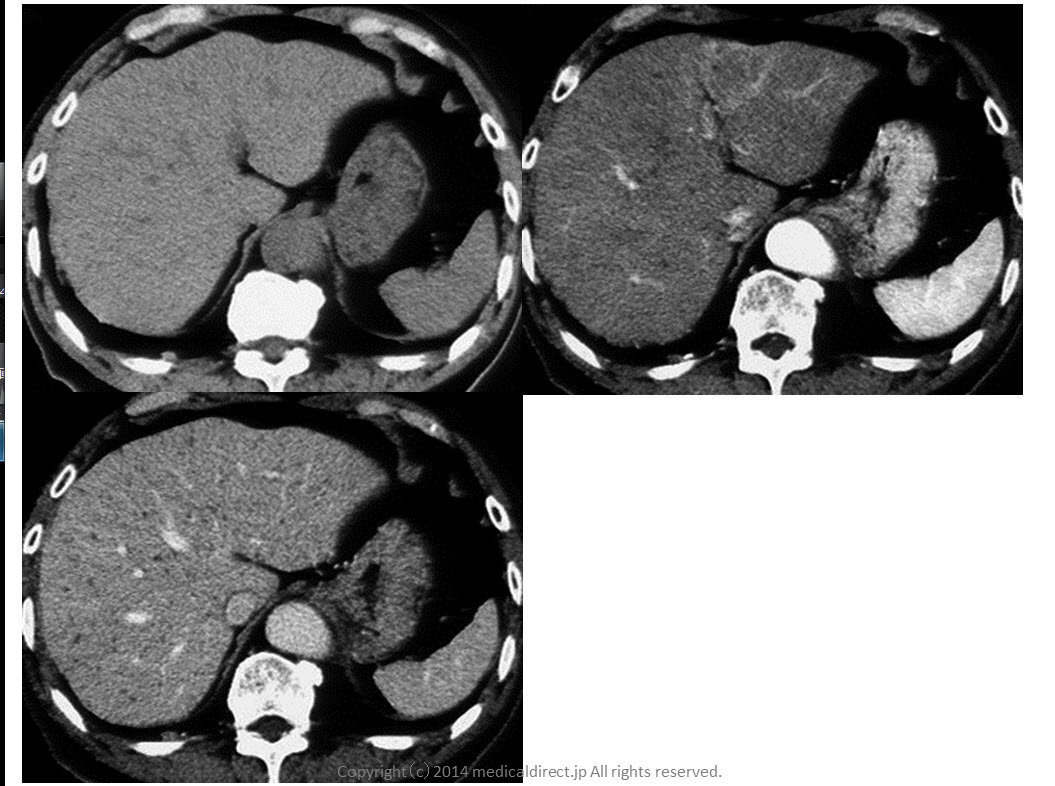
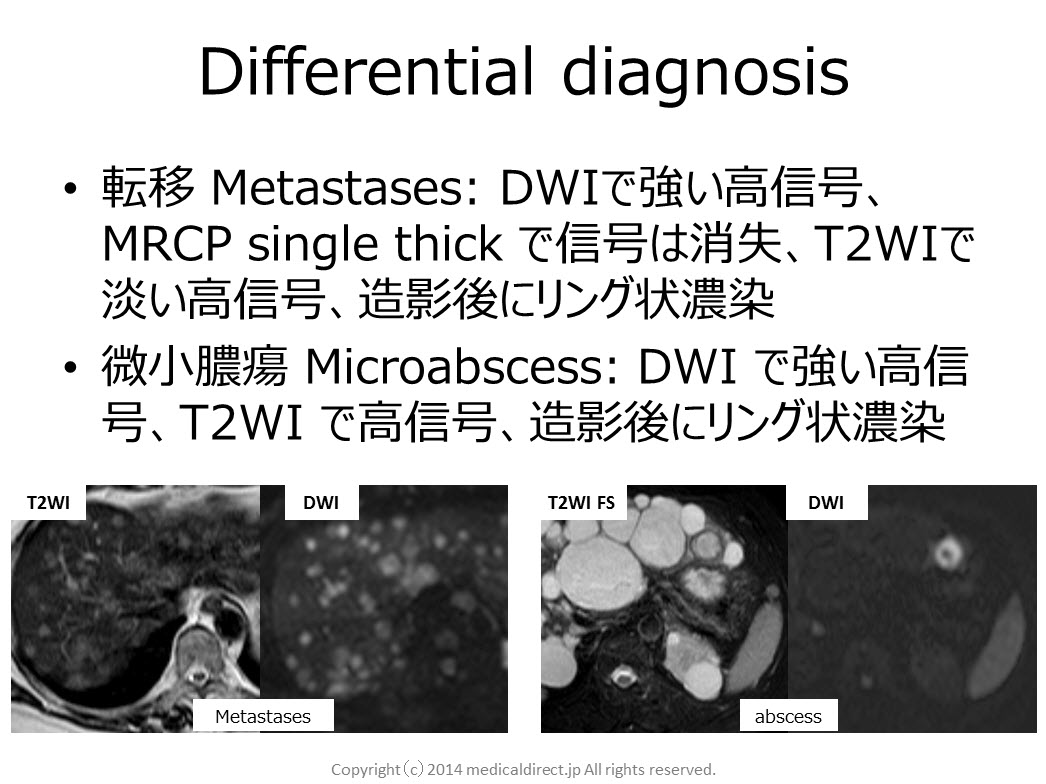
20140407 Multiple hepatic nodules : Answer
Key words: VMC, von Meyenburg’s complex, biliary hamartoma, 胆管過誤腫、胆管性過誤腫, comet-tail sign, DWI, diffusion weighted imaging, APKD
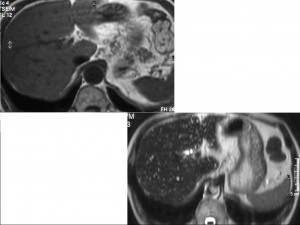
Key images:
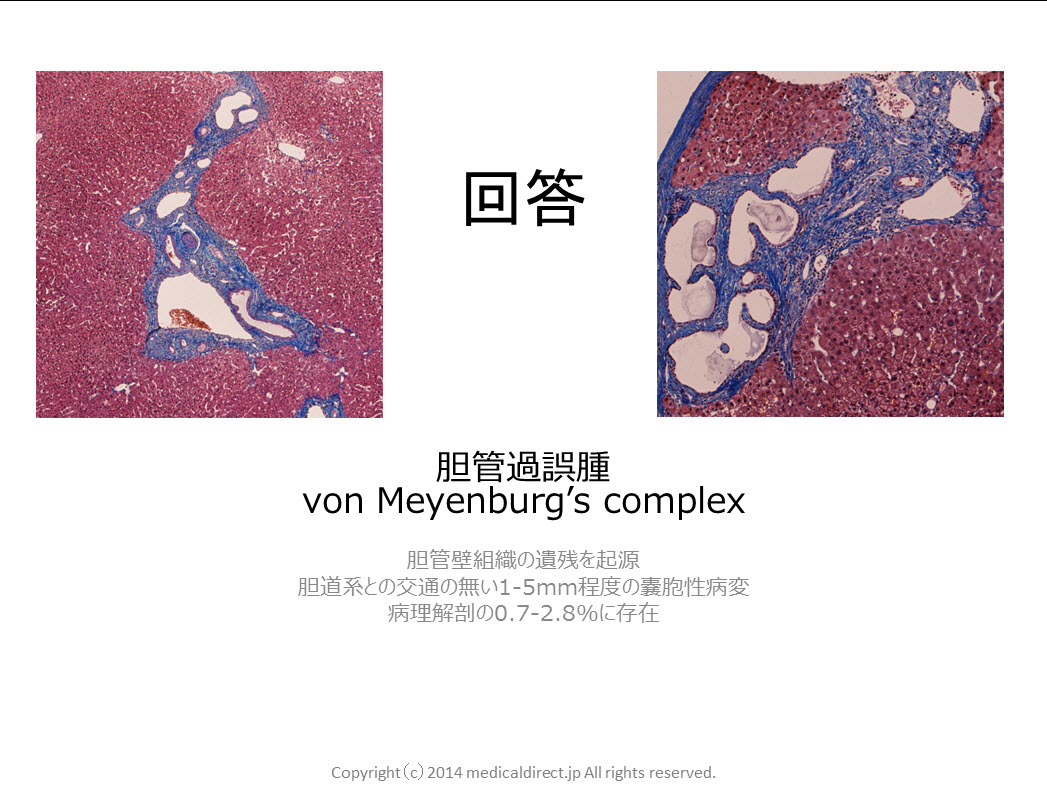
80-year-old man with VMC or biliary hamartoma.

Reference
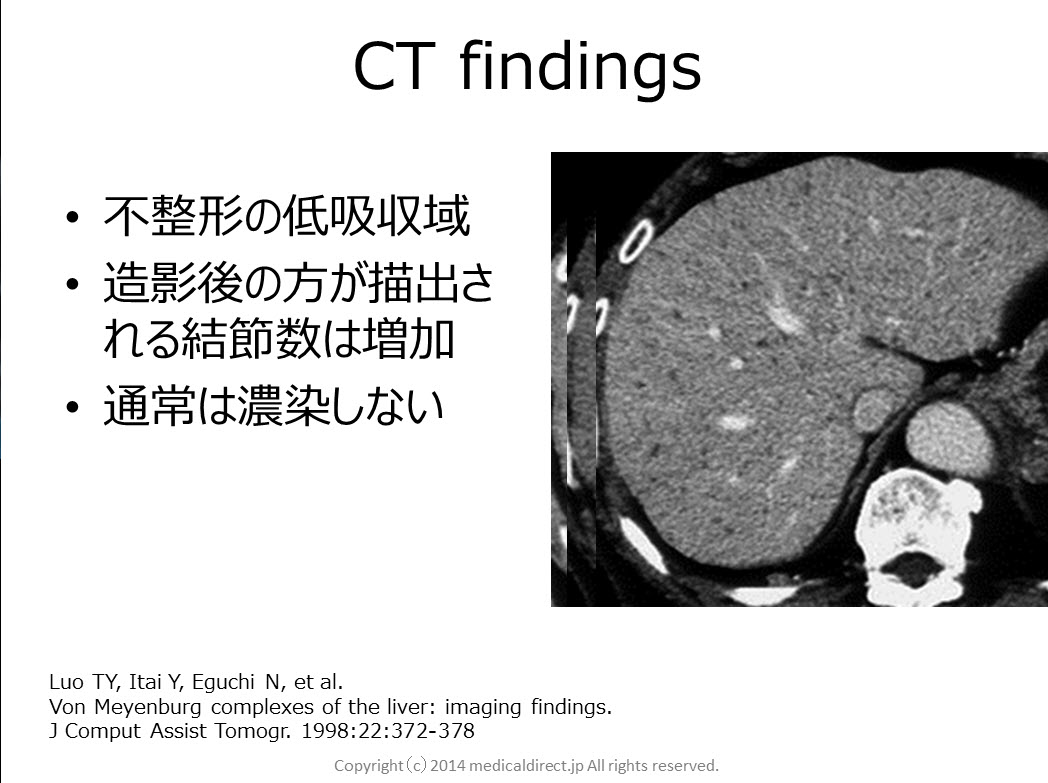
1) Luo TY, Itai Y, Eguchi N, et al.
Von Meyenburg complexes of the liver: imaging findings.
J Comput Assist Tomogr. 1998:22:372-378
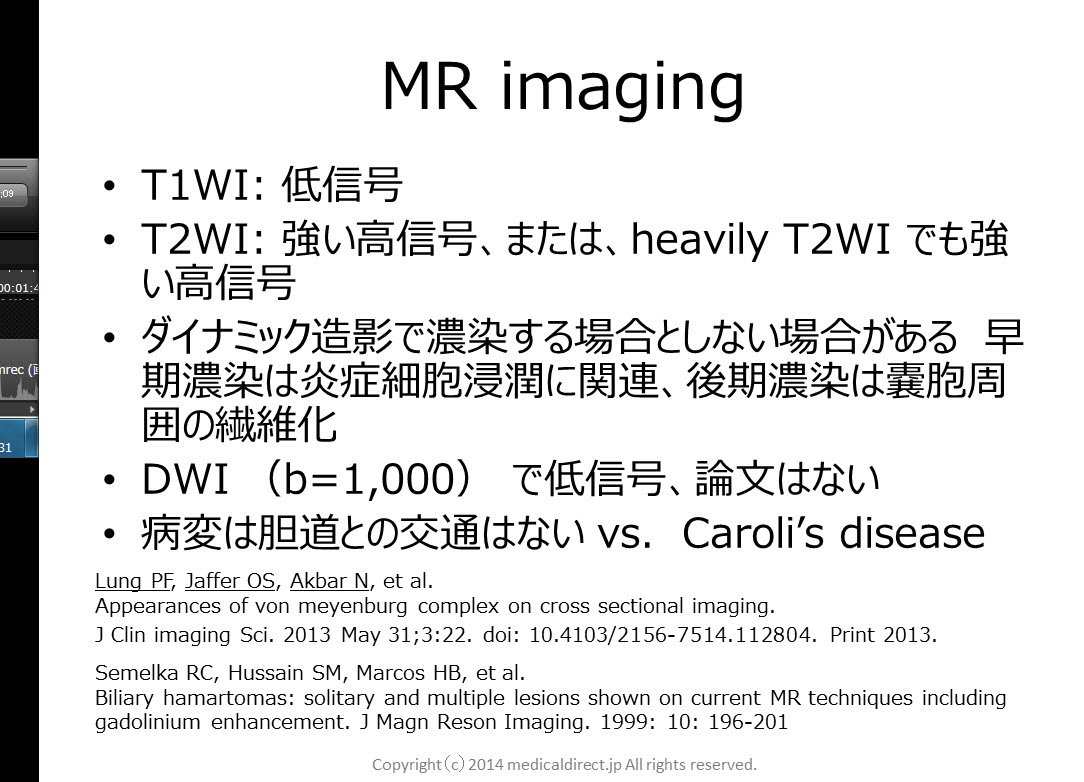
2) Lung PF, Jaffer OS, Akbar N,et al.
Appearances of von meyenburg complex on cross sectional imaging.
J Clin imaging Sci. 2013 May 31;3:22. doi: 10.4103/2156-7514.112804. Print 2013.
3) Semelka RC, Hussain SM, Marcos HB, et al.
J MagnReson Imaging. 1999: 10: 196-201
4) MorteléB, Mortelé K, Seynaeve P, et al.
Hepatic bile duct hamartomas (von Meyenburg Complexes): MR and MR cholangiography findings.
J Comput Assist Tomogr. 2002 May-Jun;26(3):438-43.
5) Lev-ToaffAS, Bach AM, Wechsler RJ, et al.
The radiologic and pathologic spectrum of biliary hamartomas.
AJR Am J Roentgenol. 1995 Aug;165(2):309-13.
6) Maher MM, DervanP, Keogh B, et al.
Bile duct hamartomas (von Meyenburg complexes): value of MR imaging in diagnosis.
Abdom Imaging. 1999 Mar-Apr;24(2):171-3.
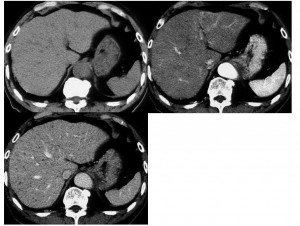
80-year-old man with multiple hepatic nodules.
He has a small gallbladder cancer with 15mm in diameter.
iphone はこちらの動画で
You tube 動画はこちら
音声のみを聞かれる場合こちら
Key images: クリックすると拡大します


Key words:
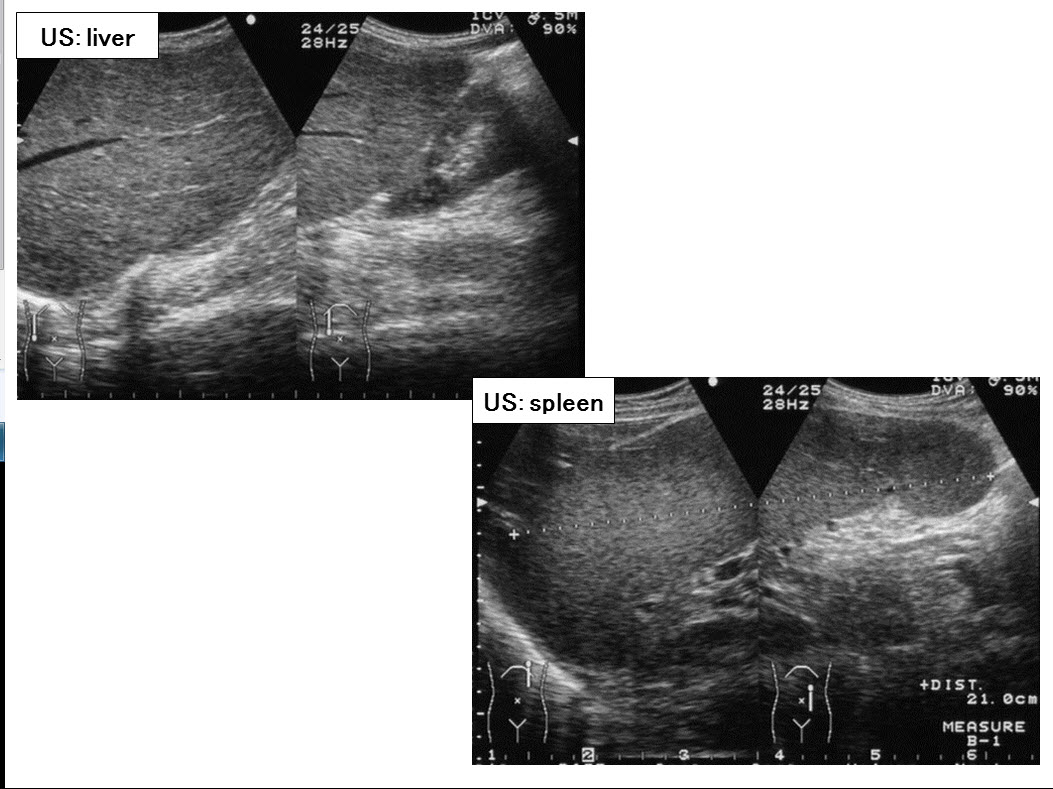
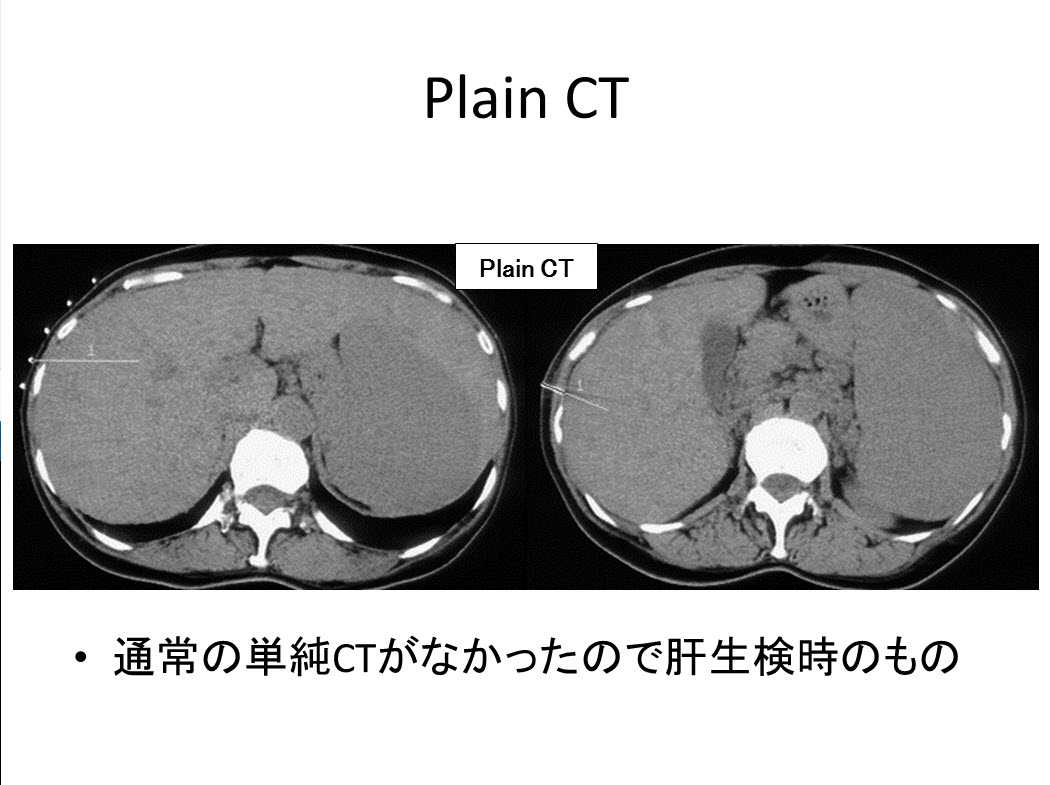
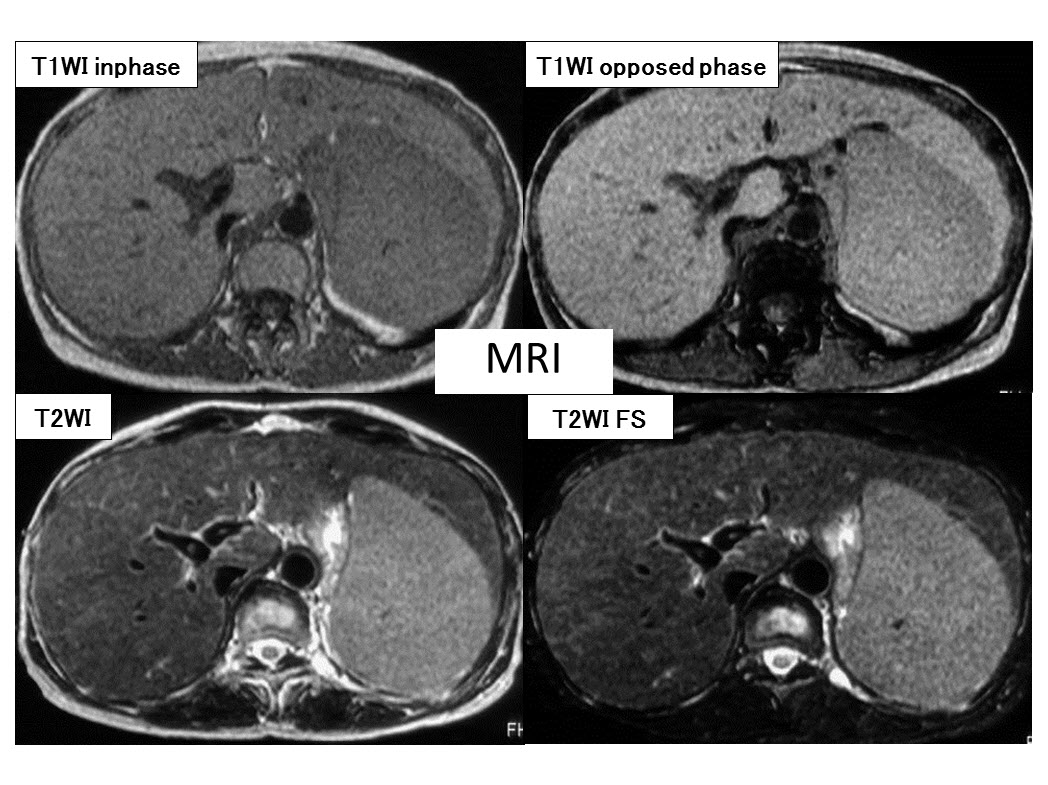
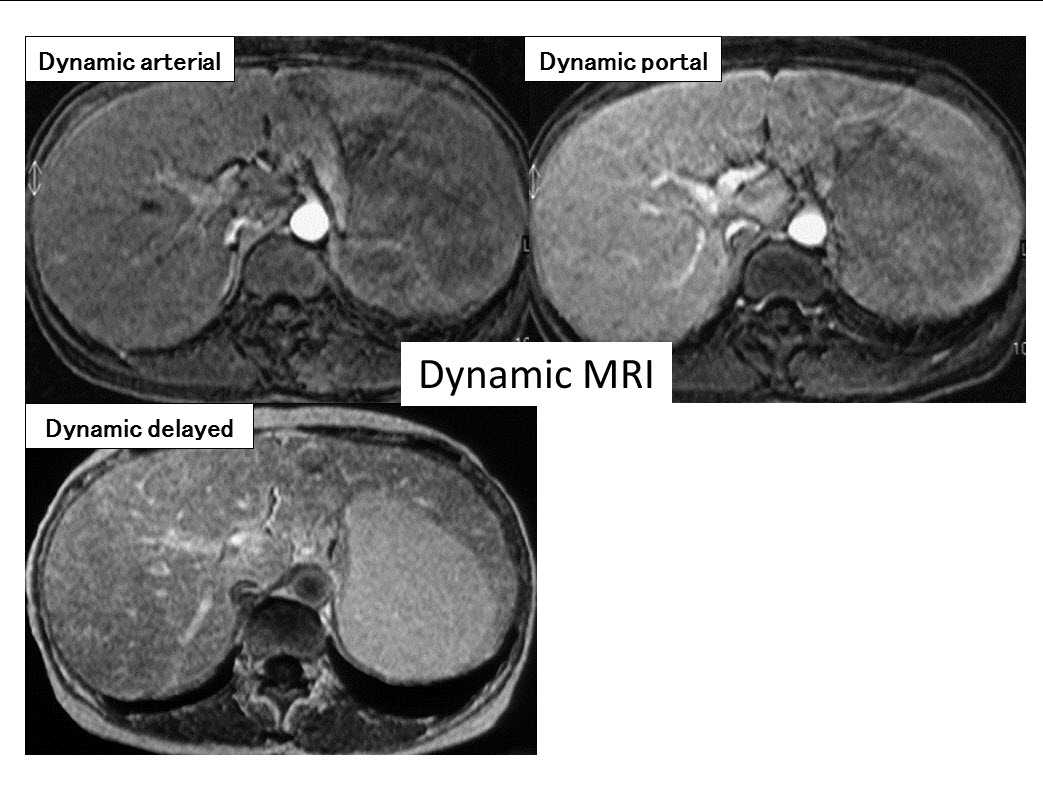
Sarcoidosis, サルコイドーシス、類上皮非乾落性肉芽腫性疾患、肝脾サルコイドーシス、ACE, CD4/CD8, Panda sign, Hepatic sarcoidosis, Splenic sarcoidosis
Reference:
Warshauer DM, et al. Nodular sarcoidosis of the liver and spleen: analysis of 32 cases. Radiology 1995; 195: 757-762
Elsayes KM, et al. MR imaging of the spleen: spectrum of abnormalities. Radiographics. 2005 ; 25(4):967-82.
Sakai T, et al. MR imaging of hepatosplenic sarcoidosis. Radiat Med. 1995 Jan-Feb;13(1):39-41.
Koyama T, et al. Rdiologic manifestations of sarcoidosis in varisou organs. Radiographics. 2004 24: 87-104
Warshauer DM, et al. Nodular sarcoidosis of the liver and spleen: appearance on MR images. J Magn Reson Imaging. 1994 Jul-Aug;4(4):553-7.
Kessler A, et al. Hepatic and splenic sarcoidosis: ultrasound and MR imaging. Abdom Imaging. 1993;18(2):159-63.